Imagine a young couple in Wandsworth in 1996. One salary buys a five-bedroom Edwardian house. The stamp duty is a small flat percentage rather than a five-figure shock. The mortgage broker is a polite man in the high street. The leasehold is a curiosity belonging to flats, not a financial trapdoor. The buyers do not think about cladding, EWS1 forms, service charges or building safety levies. They worry about wallpaper. Three decades on, almost every word of that paragraph has changed, and most of them have changed for the worse.
That is the simplest way I can put my thesis. The British housing market has been transformed structurally, not cyclically, since the late 1990s. The transformation has been driven by a series of compounding forces: dual-income households, a falling birth rate, ever-heavier transaction taxes, a thirteen-year experiment in near-zero interest rates, a state-backed funnel into new-build leasehold flats, a leasehold and cladding scandal that froze parts of the flat market in legal fog, a structural failure of supply, and a quiet, lonely shift at the top of the ladder where older owners can no longer move on. None of these forces is the whole story. All of them together are.
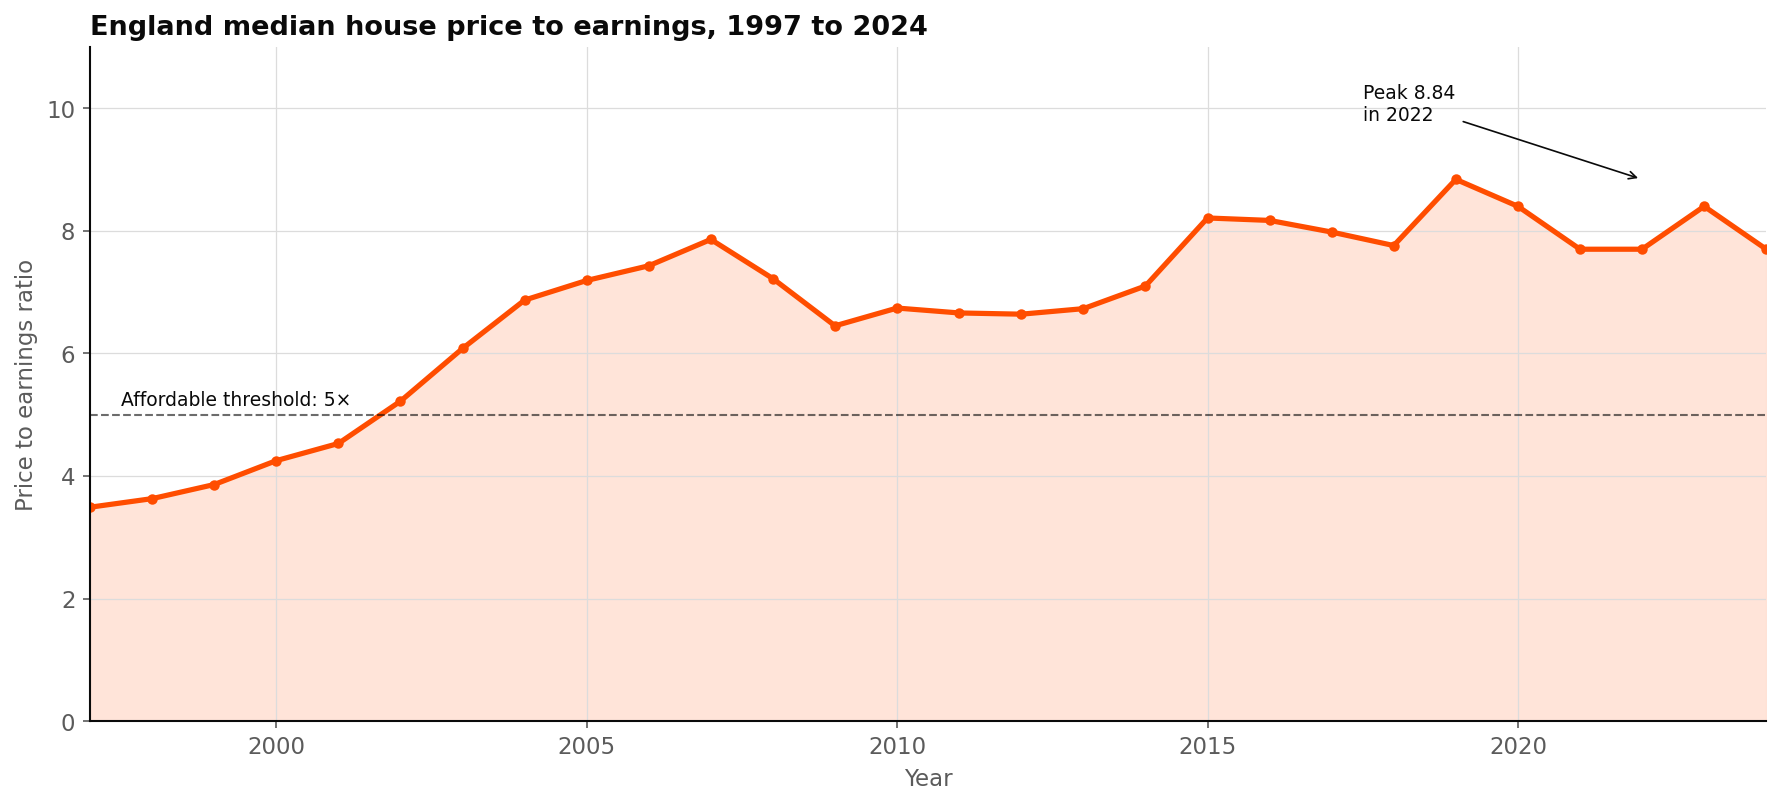
The thesis I want to make plain is this. Earnings have doubled since 1997, but house prices have more than quadrupled, per ONS Housing Affordability in England and Wales. The market has not simply become more expensive. It has become less liquid, less rational and less forgiving. It rewards the already-housed and the already-inheriting, and it punishes the would-be mover. It is not, as some now imagine, a problem mainly about young people trying to get on. It is increasingly a problem about older people trying to get off, and that is the section of this thesis I want most people to read.
Earnings have doubled since 1997. House prices have more than quadrupled. ONS Housing Affordability, 2024
Who has changed: the dual-income household, the smaller family, the older first-time buyer.
The least-discussed force in the modern market is the most consequential: the buyer of 1996 and the buyer of 2026 are not the same person. They have different incomes, different family shapes, different timelines and, crucially, a different capacity to borrow.
The two-income revolution, said carefully
Let me say this carefully, because it is the kind of point that is easy to phrase badly. Female employment has risen materially and continuously since the 1990s. According to ONS Labour Force Survey time-series data, the female employment rate for ages 16 to 64 has climbed from around 66% in 1997 to roughly 72 to 73% by the mid-2020s. This is structural, not cyclical: childcare reform, cultural shift, the rise of part-time professional work and pension reform that demands a longer working life have all embedded it.
The mortgage market has followed. FCA data cited by the ONS shows that 60% of new mortgages in Q1 2024 were based on joint income, and Uswitch projections have the share of single-income mortgages dropping below 31% by late 2025. Two earners can access roughly 1.5 to 1.75 times the borrowing capacity of one earner on the same gross household income.
The wrong way to write that point is to say "women joining the workforce caused house prices to rise." The accurate version is that the transition from primarily single-earner to predominantly dual-earner households expanded household borrowing capacity, and in a market starved of supply, that extra capacity was capitalised into higher prices at every level. It is most visible in the £600,000 to £2 million bracket of London and the South East, where two professional salaries are now a prerequisite to play.
The shrinking family
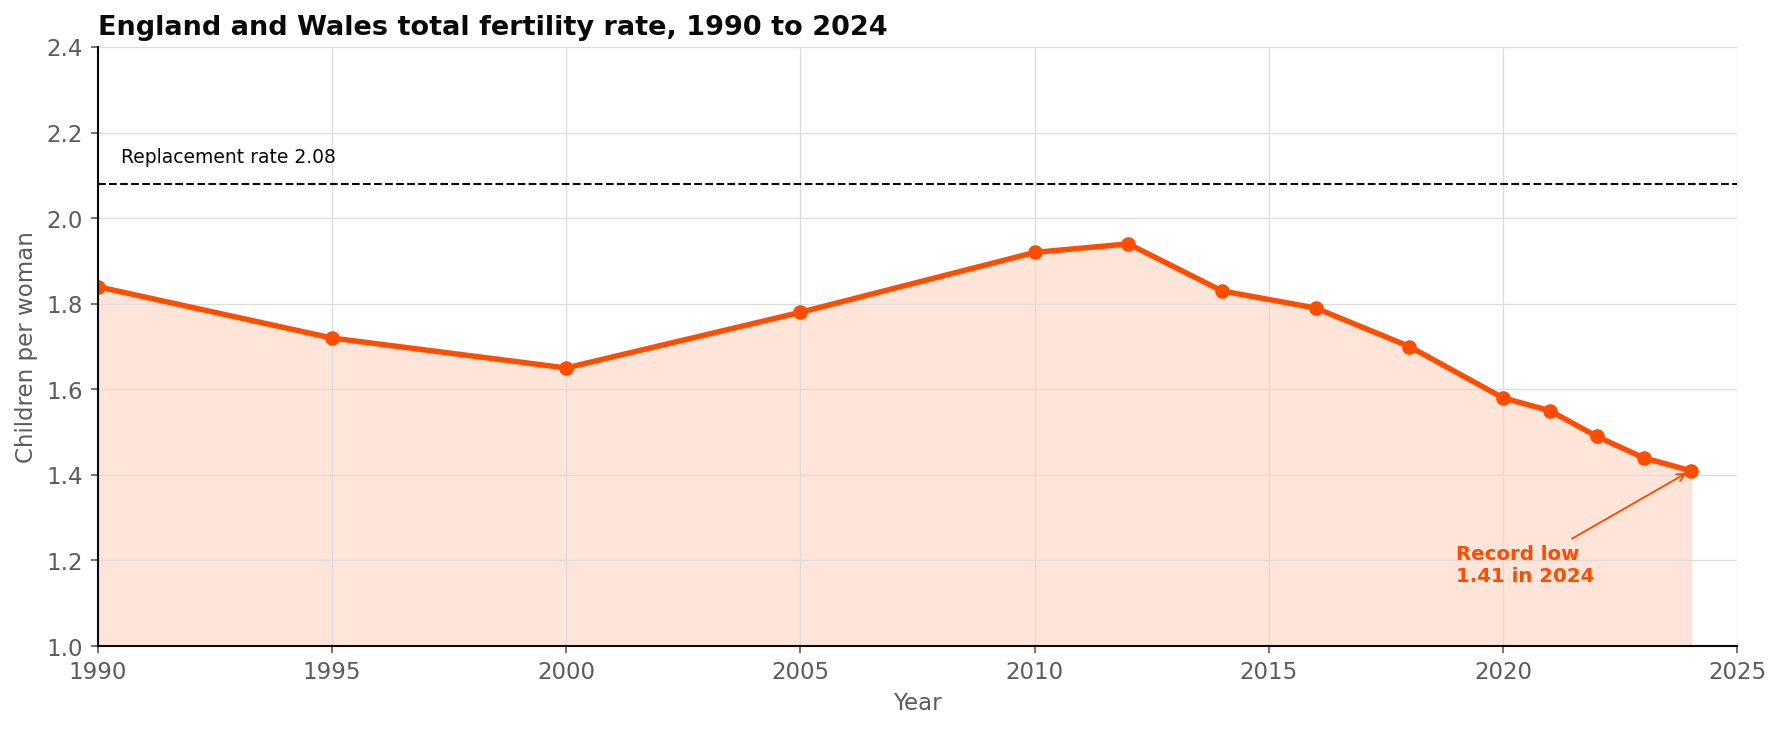
The fertility number has done something quietly historic. ONS data for 2024 places the total fertility rate at 1.41 children per woman in England and Wales, the third consecutive record low, well beneath the 2.08 replacement rate. The BMJ confirmed this is the lowest rate since records began in 1938. For context, the TFR was 1.84 in 1990 and 1.92 as recently as 2010.
The housing consequence is direct. Only 14.8% of families with dependent children in 2024 had three or more, per ONS Families and Households 2024. The natural pool of buyers for a genuine five-bedroom family house is shrinking each year. The buyers who do have three or more children are, on average, wealthier and more capable of competing for the best stock, so the top of the family-house market can look strong precisely because the middle of it is thinning.
The older first-time buyer
The first-time buyer of 1996 was typically 29. The first-time buyer of 2024 is 34, with the proportion of under-25 buyers having fallen from a quarter to just 6%, per Skipton Group research reported by the BBC. They also arrive at the door with help: Savills figures reported by the BBC show 52% of first-time buyers in 2024 received family support, averaging £55,572 per transaction, a national total of £9.6 billion that year. The Resolution Foundation projects that the annual value of inheritances will roughly double over the next twenty years, locking in a self-reinforcing inequality between those whose parents own and those whose parents do not.
| Metric | ~1990 | ~2000 | ~2010 | 2024 |
|---|---|---|---|---|
| Total fertility rate (E&W) | 1.84 | 1.65 | 1.92 | 1.41 |
| Average household size | ~2.56 | ~2.43 | ~2.40 | 2.35 |
| Families with 3+ dependent children | ~20% | ~18% | ~16% | 14.8% |
| First-time buyer average age | ~29 | ~31 | ~32 | 34 |
What it now costs to buy: thirty years of escalating transaction taxes.
Stamp duty in 1996 was a polite 1% on most things, paid almost as an afterthought. Stamp duty in 2026 is one of the largest single cash items in a typical move, and at the top end it has become the deciding factor in whether the move happens at all.
From slab to slice, and from gentle to punishing
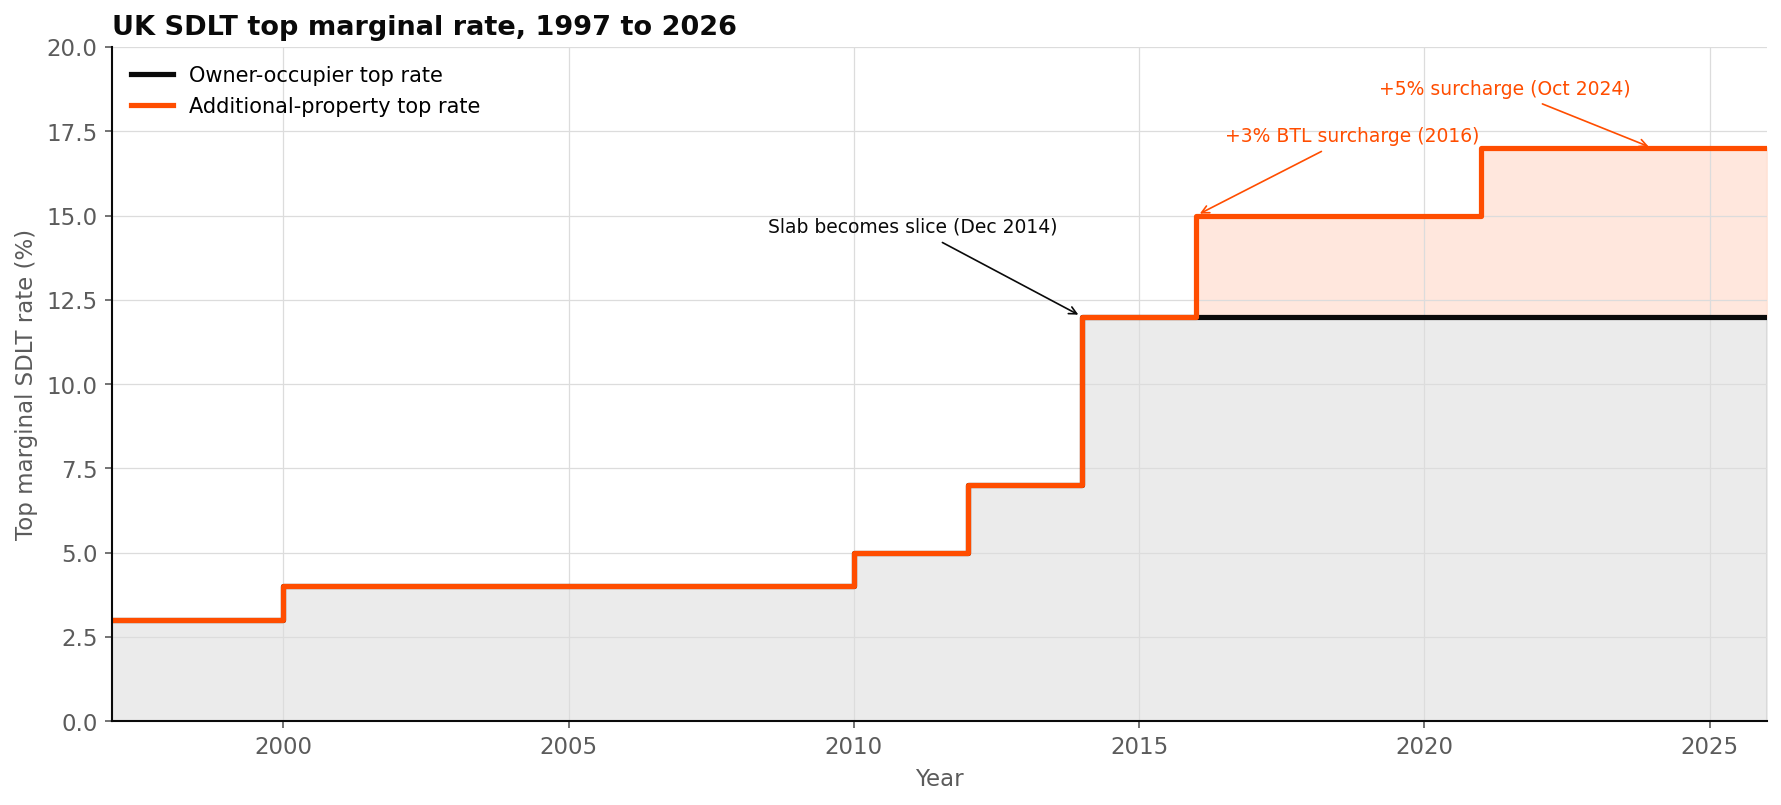
Pre-1997 stamp duty was a 1% slab charge above £60,000. The incoming Labour government began a sustained escalation, adding higher bands in 1997 and 1998, lifting the top rate to 4% in 2000, replacing the regime with SDLT in 2003, adding a 5% band at £1m in 2010 and a 7% band at £2m in 2012. The defining reform came in December 2014, when SDLT became a progressive slice on portions of value rather than a slab on the whole, lifting the top rate to 12% on the portion above £1.5m.
Then came the buy-to-let attack. The 3% additional homes surcharge arrived in April 2016. A 2% non-UK resident surcharge followed in April 2021. In October 2024 the additional-homes surcharge was lifted from 3% to 5%, and the SDLT rate for corporate purchases over £500,000 was raised from 15% to 17%, per Saffery and Price Bailey.
The arithmetic of a £2 million purchase
A £2 million owner-occupier purchase now incurs SDLT of approximately £153,750 at standard rates after April 2025. Add the additional-property surcharge and it is roughly £253,750. Add the non-resident surcharge on top and you reach about £293,750. That is between 12.7% and 14.7% of the purchase price, compared with an effective rate of around 1.5% on the same property in 1996. Research from the Centre for British Progress estimates that each 1% of stamp duty reduces transactions by roughly 10%. The cumulative effect on liquidity is large.
A £2 million house bought in 1996 carried roughly £30,000 in stamp duty. In 2026, the same purchase by a non-UK resident on an additional property carries closer to £294,000. The market has not just become dearer, it has become harder to move within.
ATED, CGT, Section 24, and the death of the casual landlord
While stamp duty was rising, the rest of the tax stack was being rebuilt around the landlord. ATED, the Annual Tax on Enveloped Dwellings, was introduced in April 2013, originally on residential property worth over £2 million held in corporate envelopes, with the threshold falling to £500,000 by 2016. Current charges per the HMRC historic table run from £4,400 to more than £279,000 a year by value band. Combined with the 17% corporate SDLT rate, the casual corporate envelope is essentially finished.
Capital gains tax on residential property has been recalibrated repeatedly. Non-UK residents now pay UK CGT on UK property. The annual exempt amount has been slashed from £12,300 to £3,000 in two steps. Higher-rate CGT on residential property was 28% and is now 24% (a small cut in October 2024), with disposals reportable within 30 days. The IFS has the full schedule.
The most consequential change for individual landlords was Section 24, announced in 2015 and phased in between 2017 and 2020. Mortgage interest stopped being deductible as a business expense for personal landlords, replaced by a 20% tax credit. As LandlordStudio and uklandlordtax.co.uk explain, this means a higher-rate landlord can end up paying tax on rental income that exceeds their after-interest profit, an effective marginal rate above 100% on net rental income for the worst-affected. Combined with the 2016 abolition of the 3.6% Wear and Tear Allowance, the rational casual landlord has been pushed out, while the rational professional one has been pushed into a limited company.
The state-sponsored new-build funnel: cheap money, Help to Buy and Shared Ownership.
The 2010s were not just an accident of low rates. They were also a sustained, state-backed effort to keep first-time buyers buying. The intention was good. The result was complicated, because the buyers were funnelled into precisely the stock that would shortly become the most legally and financially awkward to own.
Ultra-low rates and what they did to behaviour
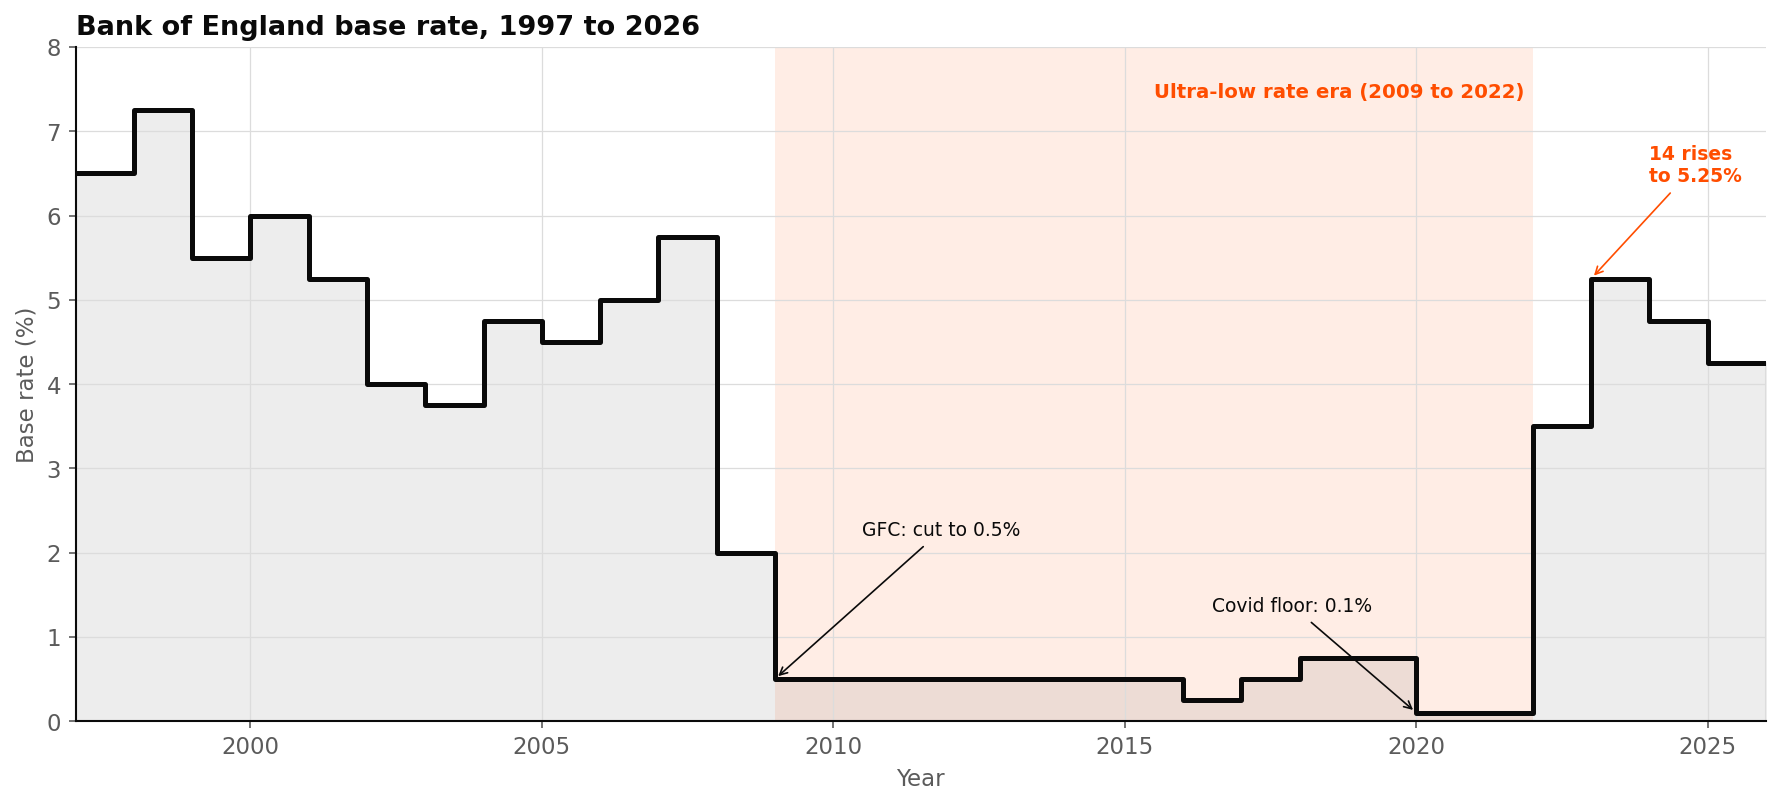
Between March 2009 and December 2021, the Bank of England base rate sat between 0.1% and 0.75%. Mortgage rates of 1 to 3% became normal. Quantitative easing peaked at £895 billion, and the Bank's own analysis conceded that QE inflated asset prices, with a 2012 study finding that 40% of the wealth gains accrued to the richest 5% of households. Theresa May said the quiet part out loud in 2016: monetary policy had helped those on the ladder at the expense of those off it.
Three behavioural legacies of that era still shape the market.
- The forever-home compression. Cheap money let buyers skip rungs, taking on four-bedroom houses in their early thirties that they would historically have bought in their forties, on the unspoken assumption that rates would stay low forever.
- The BTL surge. A 0.5% base rate made levered buy-to-let yields of 5 to 7% look extraordinary. Many of those mortgages are now being refinanced at three to five times their original rate.
- The savings distortion. Near-zero deposit rates removed any rational case for holding cash, and steered discretionary wealth into property.
Then in late 2021 the music stopped. The base rate climbed from 0.1% to 5.25% through fourteen consecutive rises, the sharpest tightening cycle in a generation. Affordability deteriorated more in twenty months than it had in the previous twenty years. The FCA's old 7% stress test was scrapped in August 2022, but the FPC's loan-to-income cap remained. Cunningtons notes the new normal: 35 to 40-year terms, the polite fiction by which monthly payments are kept inside the affordability rules.
Help to Buy, with a critical eye
Help to Buy Equity Loan ran from 2013 to 2023 and supported 387,195 property purchases in England, backed by £24.7 billion of equity loans and £109.2 billion of property value, per GOV.UK. The scheme was explicitly for new-build, with loans up to 20% of purchase price, rising to 40% in London from February 2016.
That sounds like progress, and in many ways it was. The National Audit Office credited it with raising home-ownership and supporting supply. But the NAO also flagged that a proportion of users could have afforded a home without help, and that some buyers could face a negative-equity trap exacerbated by the new-build premium. Academic analysis found that in Greater London, Help to Buy lifted new-build prices by around 6% with no discernible effect on construction volumes. Subsidised demand met inelastic supply, exactly as economics would predict, and developers priced it in.
The interaction with leasehold made it worse. The CMA's leasehold investigation opened in 2019 over concerns about onerous ground rents, doubling clauses, permission fees and other terms. Many Help to Buy purchases were leasehold flats, sold by professional developers to first-time buyers with limited property literacy. The real long-term cost sat inside the lease, the freeholder, the managing agent and the service charge machinery, not the headline price. Then building safety landed on top. Homes England's own guidance tells Help to Buy owners in cladding-affected blocks that they may need an EWS1 form to repay the equity loan or remortgage, and that the value of their home could be affected if a fire risk is identified.
Shared Ownership and Rent to Buy: the ladder propped against the wrong wall
Shared Ownership is sold as part-buy part-rent ownership. The House of Commons Library states plainly that Shared Ownership properties are always leasehold, and that owners commonly remain liable for 100% of the service charge regardless of the size of their owned share. The National Audit Office's 2026 investigation reports there are now more than 250,000 households in shared ownership in England, up from 202,000 in 2020. Rising service charges and staircasing costs create real affordability pressure over time, and the BBC's coverage of the findings records owners feeling "trapped", "unsellable" or facing service charges that make the product "wildly unaffordable".
Rent to Buy is smaller and less central, but it belongs to the same family. GOV.UK guidance describes it as reduced rent to help tenants save a deposit, but the typical five-year route often ends in a Shared Ownership purchase, returning the buyer to the same leasehold, service-charge and staircasing world.
The honest conclusion. Help to Buy, Shared Ownership and Rent to Buy were designed as ladders. In too many cases, the ladder was propped against the wrong wall. The schemes pushed buyers towards new-build leasehold stock at exactly the moment that leasehold terms, building-safety obligations, service charges and new-build premiums were turning from background detail into front-page risk.
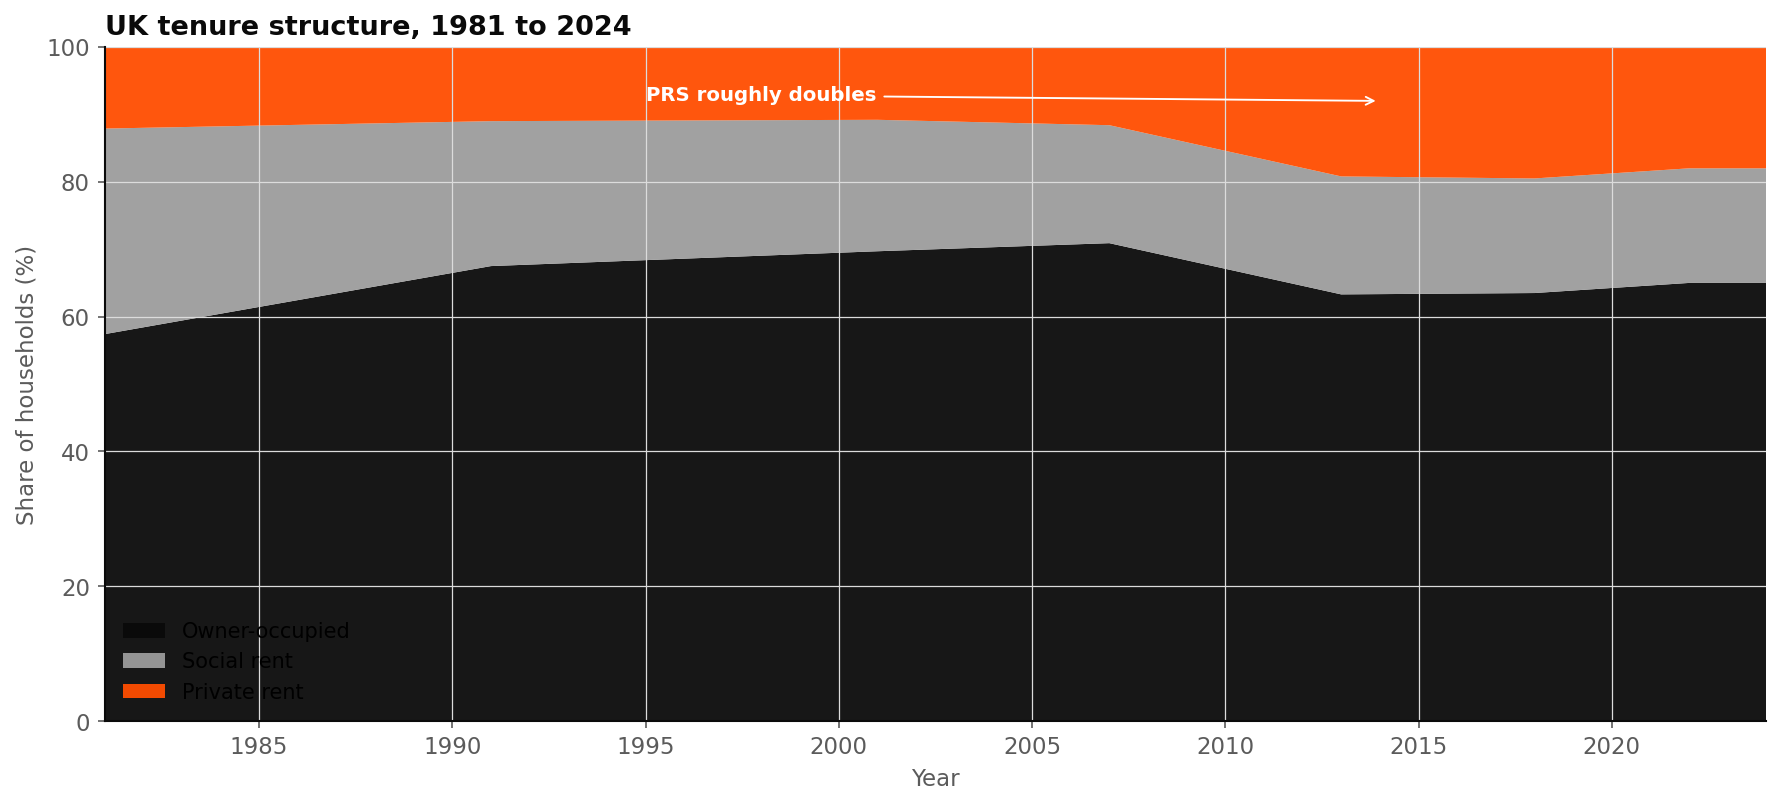
The landlord exodus, and why ex-rentals do not simply become first homes.
The private rented sector grew from 11% of English households in 2001 to nearly 20% by 2017, then stopped. The reasons it stopped are well-known: Section 24, the 3% surcharge in 2016, the 5% surcharge in 2024, sharply higher rates, EPC pressure and now the Renters' Rights Act. What is less understood is why landlord exits do not translate cleanly into homes for first-time buyers.
Where the landlords went
Per HMRC data quoted by MoneyWeek in September 2025, there were 2.84 million unincorporated BTL landlords in 2023, and the number with a BTL mortgage fell by 65,000 between 2023 and 2024, with an estimated 93,000 additional exits projected in 2025. NRLA survey data found a record 26% of landlords sold at least one property in 2024 while only 8% bought.
Add to this the Renters' Rights Act 2025, which took effect on 1 May 2026, abolishing assured shorthold tenancies and Section 21 no-fault evictions and introducing a national landlord and property database. EPC C targets for 2030 already have 23% of landlords planning to sell some or all of their portfolio. The professional, incorporated landlord remains. The casual two-property landlord is leaving.
Why an ex-BTL is not automatically a first-time-buyer home
The lazy thesis is that landlord exits free homes for first-time buyers. The evidence is more complicated.
- Stock type mismatch. Alan Boswell data shows 30% of rental properties are terraced houses, 17% semi-detached and roughly 30% flats. Leasehold flats, particularly in London, exit the rental sector straight into the building-safety, EWS1 and marketability problems set out below.
- Price quantum. The median BTL property is typically a 1 to 2 bed flat originally acquired for £120,000 to £200,000, or £300,000 to £600,000 in London. These are not always FTB-accessible even with no landlord bid.
- Alternative buyers. Exiting landlords frequently sell to incorporated landlords, owner-occupiers trading down, or probate buyers.
- London flat doom loop. Departing private landlords leave a stock segment (purpose-built flats, often leasehold, often above 18 metres) that institutional build-to-rent will not replace at scale, because BTR overwhelmingly builds new.
The renter pays
With supply contracting and demand persistent, rental growth has been severe. ONS data shows average UK private rents rose 3.5% in the year to April 2026 to £1,381 per month. London is on roughly £2,661 a month, 44% above the next most expensive region. Annual growth peaked at 8.9% in June 2024. The renter has paid for the tax stack, the cost of capital and the policy programme that drove the landlord out.
The flat market in fog: leasehold, cladding and the divergence from houses.
Houses and flats used to track. Now they do not. Per PropertyData, the average UK flat was £161,000 in 2015 against £218,000 for a house, a £57,000 gap. By the early 2020s, the gap was £130,000. Flats have underperformed every other property type.
The leasehold scandal and the law catching up
Between roughly 2010 and 2017, major housebuilders sold new-build houses on leases with ground rents that doubled every ten years rather than tracking RPI. Properties became unmortgageable within one or two review cycles. Taylor Wimpey eventually set aside £130 million in compensation. Up to 4.5 million leaseholders were potentially affected by some form of problematic ground rent.
The legislative response has come in stages. The Leasehold Reform (Ground Rent) Act 2022 banned ground rents on new leases from 30 June 2022, replacing them with a peppercorn. The Leasehold and Freehold Reform Act 2024, signed into law on 24 May 2024, extended standard lease extensions to 990 years with no ground rent, banned new leasehold houses except in special cases, removed the two-year qualifying period, removed marriage value from enfranchisement premiums and increased commercial space limits for collective enfranchisement, per the HomeOwners Alliance. A High Court ruling in October 2025 dismissed the freeholders' legal challenge in full.
The draft Commonhold and Leasehold Reform Bill of January 2026 proposes banning new leasehold flats outright and capping ground rents at £250 per year, immediately affecting nearly one million leaseholders and another five million in time. Leasehold is not abolished, but it is being substantially reformed, and the direction of travel is unmistakable.
Grenfell, EWS1 and the freeze
The Grenfell Tower fire in June 2017 killed 72 people and exposed systemic failures in building-safety regulation. The regulatory and mortgage response froze transactions in affected buildings. The Building Safety Act 2022 defined the higher-risk building (18 metres plus or seven storeys plus with residential use), created the new regulatory regime, gave qualifying leaseholders protection from cladding remediation costs, and capped non-cladding defect costs at £10,000 outside London and £15,000 inside it. The protections transfer automatically to new buyers, which matters for marketability, per Farrer & Co.
EWS1, the External Wall System form introduced by RICS in 2019, became the practical chokepoint. By 2021 it was required for almost all blocks, freezing an estimated 1.5 million leaseholders from selling or remortgaging. Revised RICS guidance in December 2022 narrowed the scope. DLUHC data for Q1 2024 showed only 9% of flat valuations required an EWS1 overall, though 46% of valuations on buildings of seven or more storeys still did.
Why flats underperform
Six causes intersect. Leasehold uncertainty. Lingering EWS1 drag and market-wide stigma. Service-charge escalation, with some London mansion blocks now reporting service charges of £10,000 to £50,000 a year. The collapse of BTL demand for one and two-bedroom flats post-Section 24 and post-5% surcharge. A post-pandemic preference for space and gardens over proximity. And remote working, which has cut the commute premium that once justified a city-centre flat.
Realyse's April 2026 analysis reports that London BTR starts fell by 93% between 2022 and 2025, with 23 of 32 boroughs recording no new starts in the most recent year. Institutional capital is pivoting to single-family rental in regional markets rather than London high-rise, partly on viability, partly on building-safety risk. Peter Apps' Substack analysis is a useful long-form read on the same theme. About a quarter of flats resold in 2025 went for less than the original purchase price in nominal terms, per data discussed in YouTube market analysis from October 2025.
Houses and flats used to track. Now they do not. The flat market is the place where leasehold, cladding, service charges, the landlord exodus and the work-from-home effect all meet at once.
The New Downsizing Trap: where the modern market really seizes up.
If there is one section of this thesis I want to be quoted on, it is this one. The popular story is that there are too few big family houses for too many young families. The truer, less comfortable story is the opposite. Large family houses are often plentiful and increasingly difficult to sell. The buyers have weakened. The chain freezes from the top, not from the bottom.
The corrected thesis: the missing buyer is the problem
Thirty years ago, the large family house had a clearer ladder beneath it. A couple might have three children, were less frightened of debt, faced a kinder tax environment and had a stronger emotional case to stretch into the bigger house. Today the household is smaller, the mortgage rate has tripled, the cost of living is heavier and the emotional appeal of taking on a large, expensive, energy-inefficient house has weakened considerably. The traditional next buyer has not vanished. There are fewer of them, and many who could stretch now look at the monthly mortgage, the heating bill, the SDLT, the running costs and the maintenance and decide not to play.
That does not mean every large house is in trouble. Prime school catchments, immaculate properties, rare freehold stock and the best commuter locations still perform strongly. Rightmove data reported in April 2024 showed four-bedroom detached homes posting 2.7% monthly price growth against 0.3% for smaller stock. ECB research shows large houses gained roughly 20% between February 2020 and June 2022 on the pandemic space premium, while studios and one-room flats fell 1%. But that premium was a moment, not a law. It was cheap money, lockdown psychology and a one-off rewiring of work. The post-2022 market is different.
The modern family-house market is not suffering from a simple shortage of large homes. It is suffering from a shortage of confident large-home buyers, and a shortage of suitable downsizer homes for the people who own the large ones.
Older owners are stuck in the wrong houses
The English Housing Survey, summarised by the National Centre for Social Research, shows that in 2024 to 2025, 40% of English households were under-occupied while only 3% were overcrowded. The owner-occupied sector has seen rising under-occupation. ARCO's summary of Professor Les Mayhew's research finds there are more than 15 million surplus bedrooms in the UK, with nearly 60% of them in households headed by over-65s. Only 2.5% of the UK's 29 million dwellings are defined as retirement housing.
This is not inertia or sentiment. It is a market that has stopped giving older people an elegant exit. The Centre for Ageing Better adds a useful corrective to the lazy "asset-rich pensioner" trope: there are 1.2 million people aged 55 and over in poverty living in owner-occupied homes, and 1.3 million owner-occupied non-decent homes headed by someone aged 55 or over. The house may look valuable on paper. The owner may still need cash for care, repairs, family support and an ordinary, secure old age. If the headline value stops rising, or starts to fall, the whole late-life plan begins to wobble.
The downsizer wants the same things everyone else wants
The downsizer does not, in general, want a poky retirement box, a tower block with a £6,000 service charge or another leasehold arrangement that feels like a trap. They want a smaller freehold house, a bungalow, a well-built three-bedroom commuter-town property, a manageable garden, parking, proximity to doctors, shops, transport and family. They want, in other words, exactly the stock that young families, divorcees, first-time buyers with help from parents, and local movers also want.
Strutt & Parker's downsizing research captures this: 42% of homeowners are open to downsizing if the right property exists. Eighty per cent of downsizers still require space for hosting. Thirty-five per cent of over-65s say outdoor space is a deciding factor. Forty per cent will only move if the kitchen is at least as large as the one they have now. Downsizing is not the same thing as accepting a worse life in a smaller box, and the market has been slow to admit that.
This is why the large-house market and the smaller-house market can seize up at the same time. The older owner cannot get the price they expected for the large house, because the natural buyer pool is weaker. The smaller home they want is expensive, because everyone else wants it too. The move produces less spare cash than hoped. Then SDLT, legal costs, removals, refurbishment and emotional disruption take another bite. The rational answer is often to stay put, even when the house is too large, too costly and no longer suitable.
The financial logic of downsizing has weakened
Stamp duty is the most absurd part of the picture. Strutt & Parker note that SDLT on a £600,000 home is more than £20,000, and that 27% of potential downsizers say tax benefits would make them consider a smaller home as their next move. The downsizer is being asked to pay a substantial cash penalty to do exactly what every politician claims they want them to do. At higher values, the absurdity compounds: SDLT on a £1.5 million downsize purchase by an owner-occupier is roughly £91,250 in cash, before legal, agency and refurbishment costs.
There is then the care-cost and family-support arithmetic. Many older owners have mentally allocated the value of the family home several times over: some for retirement, some for future care, some for children or grandchildren, some for inheritance, some for the next purchase. When values were rising, this fiction could survive. When the market softens, the arithmetic becomes brutal. A £2 million house that "should" have been worth £2.3 million is not just a lower sale price. It is a smaller care reserve, a smaller gift to children, a smaller inheritance and a weaker bid for the next home.
The chain consequence
If older owners cannot sell large houses at acceptable prices, those houses do not recycle into the hands of younger families. If older owners cannot buy the smaller homes they want, they do not move. If they do not move, the homes below them do not move either. The result is not merely a slow top-end market. It is a chain-wide liquidity problem that radiates downwards from the houses with the most surplus space to the houses with none.
For the article: The honest, quotable version of this argument is that older owners are now marooned, in houses that are too large for their lives, too valuable to abandon cheaply, and too illiquid to fund the next chapter with confidence. The young family below them is not the only stuck person in the chain. In many ways, they are the easier problem to fix.
The supply catastrophe: 4.3 million missing homes, and a construction sector that cannot deliver.
None of the above happens without a profound, structural failure of supply. England has been building too little for so long that the question is no longer whether we will hit the target, but whether the target was ever the right number.
Forty years of undersupply
The Centre for Cities quantifies the deficit at 4.3 million homes relative to the European average, a backlog that would take at least half a century to fill even at 300,000 a year. Annual housebuilding growth in England fell from 2% before the Town and Country Planning Act 1947 to 1.2% after it.
Recent performance is worse, not better. Per MHCLG/DLUHC indicators, 2023 to 24 saw 221,070 net additional dwellings, 6% below the prior year and 26% below the 300,000 target. Starts in the year to March 2025 were estimated at 113,220, down 17% on the previous year. Completions were 152,100, down 5%. London new starts in Q1 to Q2 of 2025 were down 54% year on year. Planning applications fell, and approvals fell faster.
A construction sector under pressure
CCE Magazine, citing EY-Parthenon, reports that construction firms accounted for 16.9% of all insolvencies in England and Wales in June 2024, above their 13.8% share of registered businesses. Total construction insolvencies reached 4,690 in the year to June 2024, 53% above 2020 levels. Forty-eight per cent of Household Goods and Home Construction FTSE companies issued profit warnings in the twelve months to H1 2024. A 2025 viability analysis found that building new homes was financially not viable in 48% of UK locations.
The structural cause is older than any current government. The Town and Country Planning Act 1947 nationalised development rights and created the conditions for land-value inflation and planning rationing. Section 106 and CIL added affordable-housing obligations that make marginal sites unviable. Land banking by the largest housebuilders rations supply to protect margins. Onward's Full House notes that since 2001, only 4.5 million net homes have been added to the English stock against 6.9 million additional people, a structural gap that sustains high rents and prices regardless of any individual policy intervention.
Right to Buy: the silent privatisation
Since 1980, 1.9 million council homes in England have been sold under Right to Buy, at an average 44% discount, generating £51 billion in nominal cash receipts. Common Wealth values those homes today at £430 billion, potentially the largest privatisation in UK history. The social sector's share of tenure has roughly halved from 31% (1980) to 16% (2024). The failure to replace sold stock at anything close to a one-for-one rate has permanently removed the social-housing safety valve that regulated PRS demand.
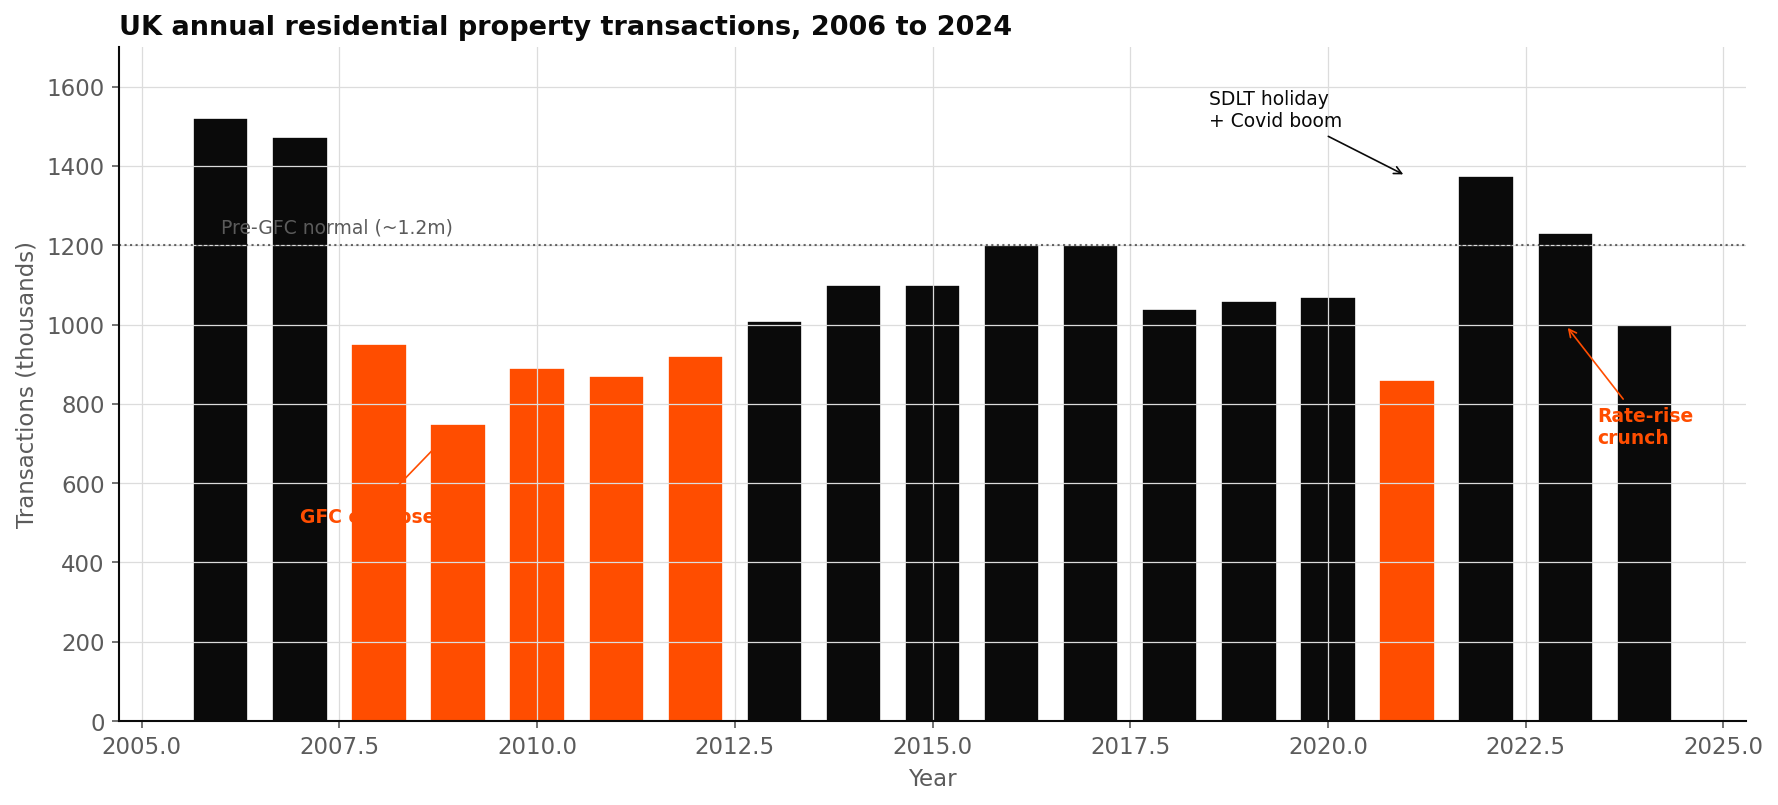
Transaction friction is part of the supply story
Transaction volumes peaked at 1.47 million in 2007, crashed to 750,000 in 2009, recovered to around 1.2 million by 2016 to 2019, hit a Covid-stimulus peak of 1.37 million in 2021, and fell back to around 1 million in 2023 (per Statista/HMRC). Average conveyancing time from instruction to completion was 120 days in 2024, rising to 160 days for sale transactions, per Today's Conveyancer. That is a structural five-month friction baked into every chain.
Immigration: what the evidence supports, and what it does not.
This is the part of the housing conversation that goes wrong most often. I want to be precise.
UK net migration peaked at roughly 745,000 to 906,000 in 2022 to 23 before moderating. The OBR now assumes around 350,000 a year in the medium term. The clearest finding from ONS analysis is that recent migrants overwhelmingly enter the private rented sector. Among EU-born residents arriving between 2014 and 2016, 88% privately rented. JRF research from 2012 found roughly 75% of recent migrants (within five years) were in private lettings.
Onward's Full House report models the cumulative effect of net migration since 2001 on English rents, finding it has added approximately £132 per month to average English rents and £216 per month in London, a 10% national uplift and roughly 15% in London above the counterfactual. The cumulative effect in London since 2001 is around £20,975 per renter. A government policy paper from 2025 draws on earlier OBR and MAC research suggesting a 1% population increase from migration corresponds to roughly a 1% rise in house prices, though sensitive to specification.
What cannot be responsibly said: that immigrant households per se pressurise owner-occupier prices (most rent), or that immigration is the dominant cause of the affordability crisis (it is one of many forces, and probably not the largest). Household-size differences between UK-born and recently-arrived reference persons are demographic composition effects: younger populations, more fertile, more recently arrived. They converge with residence duration. The defensible claim is that high net migration concentrated among working-age adults has disproportionately added to PRS demand rather than owner-occupier demand, sustaining rental sector growth even as individual landlords exit.
What comes next: commonhold, BTR, EPC, rate normalisation and the SDLT debate.
Five forces will shape the next decade. None is a silver bullet. Taken together, they could materially shift the structure described above.
- Leasehold reform and commonhold. The 2024 Act is in force, the 2026 draft Bill proposes banning new leasehold flats and capping ground rents at £250. Implementation will be slow, with significant ongoing transition risk for existing leaseholders. The direction of travel is clear, but the timetable is political.
- Institutional Build-to-Rent. The sector reached 130,000+ operational units in Q1 2025, per LSH, having more than doubled in four years. Institutional landlords still account for only 2 to 3% of the PRS. Single-family rental investment hit record levels in 2025, pivoting to regional markets rather than London high-rise.
- EPC C by 2030. Currently a proposal for private rented properties, but already a stated policy direction. As Property118 reports, 23% of landlords already plan to sell some or all of their portfolio in response.
- Rate normalisation. The base rate is at 4.25% in May 2026. The Nationwide notes that London had the largest affordability improvement in 2025 as prices fell and earnings rose, though the London price-to-earnings ratio remains 7.5×, highest of any UK region.
- SDLT reform. The Centre for British Progress argues that replacing SDLT with a Proportional Property Tax would lift transactions by an estimated 2.8% per quarter. Whether any government has the appetite to detoxify a transaction tax that delivered £17 billion of receipts in nine months is another matter.
A short checklist of what can and cannot be honestly said.
Every claim in this thesis is hedged in the dossier behind it. A short version of the most important nuances, for anyone tempted to quote me out of context.
| Claim | Honest version |
|---|---|
| Two-income households "caused" higher prices | The transition to dual-income households expanded borrowing capacity, which, given constrained supply, was capitalised into higher prices. |
| Falling fertility means weak large-house demand everywhere | Many ordinary large family houses face weaker buyer pools. Trophy stock and prime catchments can still outperform. |
| Immigration caused the housing crisis | High net migration worsened a pre-existing supply deficit and added meaningfully to rents. It is a real but partial factor in a multi-causal crisis. |
| Landlord exits free homes for first-time buyers | Landlord exits release stock, often into segments where first-time buyers face leasehold, building safety or affordability barriers. |
| Leasehold is being abolished | Leasehold is being substantially reformed. New leasehold houses are banned. New leasehold flats may follow. Existing leaseholders gain extended rights. |
| Older owners are stubbornly hoarding bedrooms | Older owners are stuck because the homes they want to buy are scarce, the homes they want to sell have weaker demand, and the tax of moving is large. |